![]()
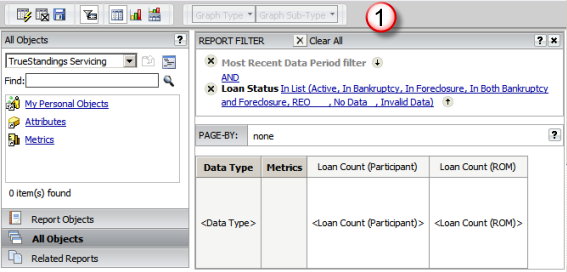
Access the Create Report (from Blank Template) and select the Grid option from the toolbar. The Design Mode will be presented in Grid view to begin defining your report elements.
Note: Depending on the CoreLogic web-based application you are using, there may be some predefined minimum required elements (e.g., Report Filter conditions, grid data elements) for the blank report.
Note: Your CoreLogic web-based application may include a set of predefined standard report layouts that will provide you with prompts to specify the attributes and metrics of a report. Once defined, you may access the Design Mode to view and edit the report details.

![]()
Define the Report Filter
Add the predefined filters and/or define the conditions you wish to apply to the source data to create the output dataset. As noted in the Filtering Data section, calculated aggregate metrics may be used in filter conditions but are not recommended when defining an aggregate report.
Refer to Defining Filter Conditions in the Filtering Data section for steps to create your report filter conditions.

![]()
Specify your Page By options
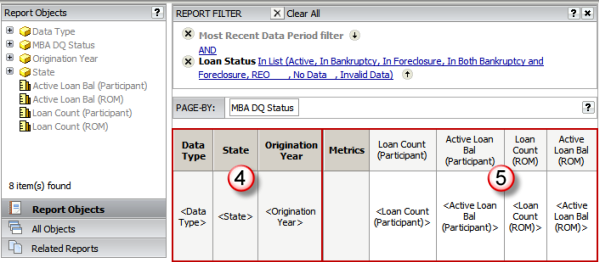
Add the attributes you wish to use to create "pages" for your output dataset. You may drag and drop the attribute(s) to the Page By panel of the Design Mode. In this example we have added the MBA DQ Status attribute to view one page of output based on the delinquency status of each underlying loan.
If the attribute is already defined on the report template layout as a row or column header, you may also right click the attribute name and click the Move to Page By Axis option to automatically move the attribute to the Page By panel.
Refer to the Page By Processing section for more information.
![]()
Note: You may also add metrics to the Page By for the report, but as the metrics are all treated as one group on the report, they must all be placed in the Page By and will be displayed as one Page By element as a drop down list of metrics. In this type of setup, you may only view one metric "page" at a time. Although this is not standard, this may fit your reporting needs.
![]()
Specify the Report Attributes to be added to the template layout
Note: Attributes that have been added to the Page By panel are already defined for the report output dataset and may not be added to the grid/graph. Typically, these are placed as Page By for "paging" and rows, but you may place them where needed to best fit your analysis.
From the All Objects view of the Object Browser, you may drag and drop an attribute on a specific position on the grid (row or column header sections) or right click the attribute and select the Add to Grid option.
When you select the Add to Grid option, the attribute is added as the last row header on the report layout. You may place an individual attribute as a row, a column or a Page By. An attribute is placed on the grid independently of other attributes.
Refer to the Report Template section for more information.
![]()

Note: As you add attributes and metrics to the report layout, the Report Objects list in the Object Browser displays the list of data elements you have included in the output. Those data elements included in the grid (i.e., Page By, row or column on the layout) will be displayed in a greyed out font. If a data element is included in the output but not on the initial view of the grid (i.e., Page By, row or column), the data element will be listed in the Report Objects but it will not be greyed out.
![]()
Specify the Report Metrics to be added to the template layout
As noted in the Report Template section, metrics are added as one group on the report. They must all either be on the Page By panel or defined as row or column elements. Typically, these are placed as columns but you may place them where needed to best fit your analysis.
From the All Objects view of the Object Browserr, you may drag and drop a metric on a specific position on the grid (row or column header sections) or right click the attribute and select the Add to Grid option.
When selecting the first metric for a report using the right-click menu option, the metric is automatically placed as in the column section of the template by default.
Once the first metric is assigned to the template, any additional metrics will automatically be assigned the same placement on the template. The metrics may be moved between Page By, row or column sections as a group.
Refer to the Report Template section for more information.
![]()
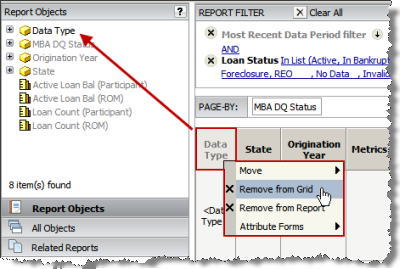
From the grid, you may remove an item from the report or just from the initial view of the grid using the right click menu. When you right click a data element, a popup menu is presented. When you select the option to "Remove from Grid", the data element is included in the output but not shown on the grid. When you select the option to "Remove from Report" the data element will not be included in the output dataset.
As noted above, the data elements that are included in the output and are on the grid will be greyed out. Those data elements in the output but not on the grid will not be greyed out. You can add those data elements to the grid while viewing the output after the report is run.

![]()
Save the report
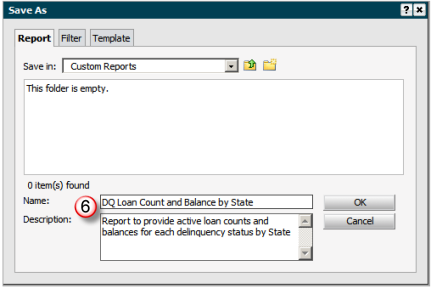
Once you have defined the report details, click the Save As button to save the report. When saving your new custom report, it is recommended that you include a description that identifies information about the report for clarity.
If the report is to be used by other members of your work group, you should save the report to your company shared folder in Shared Reports. If this report is only being used by you, you may save it within My Reports. You may add subfolders to further group your report sets.
In this example, the report is being saved to My Reports in a subfolder named Custom Reports.
